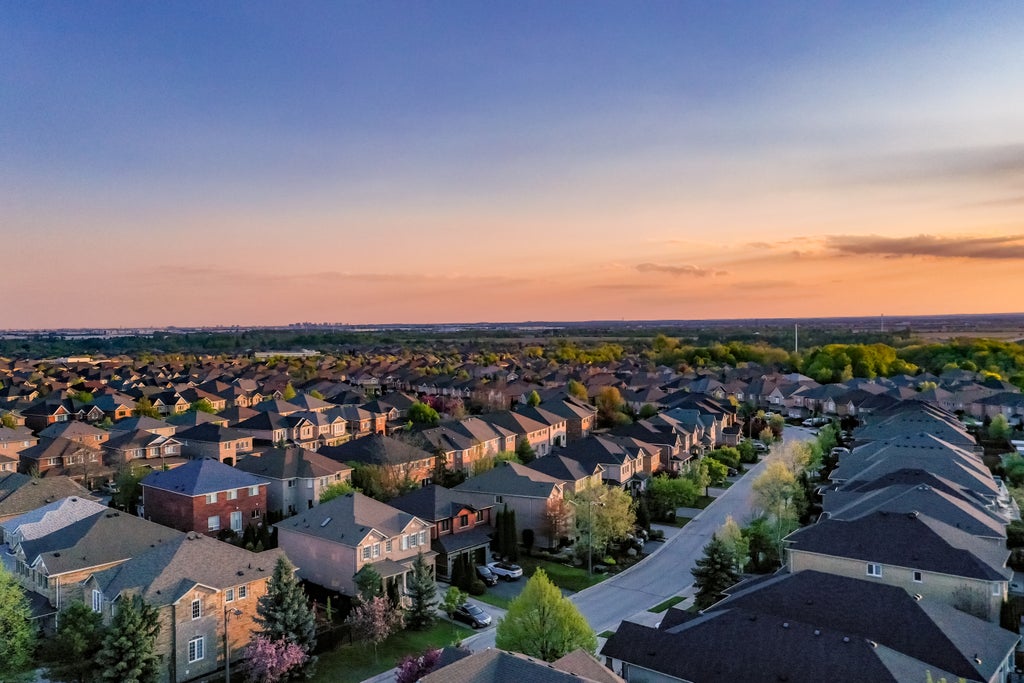
Homes are in short supply in the U.S. But this reality is not because construction has come to a standstill.
In fact, depending on where you look, it can seem like new homes are being built on every corner. There just aren’t enough yet to satisfy demand.
With demand for housing still high, the question that everyone has is: Where will development start next?
Using growth indicators that measure the telltale signs signaling upcoming construction, Cotality found the following metropolitan statistical areas (MSAs) are primed for development:
- Lakeland, FL
- Austin, TX
- Raleigh, NC
- Dallas, TX
- Port St. Lucie, FL
- San Antonio, TX
- Wilmington, NC
- Cape Coral, FL
- Boise City, ID
- Las Vegas, NV
Looking at the top 20 metro areas that are showing signs of future growth, it is noteworthy that the majority are in the South. Only four of the MSAs shown in Figure 1 are not located in either Texas, Florida, North Carolina, South Carolina, or Tennessee.
To measure whether a metro area is on the verge of growth, Cotality combines several different indicators. These indicators score the share of new construction properties in a metro area that were sold within the last two years, the share of new construction built within the last three years, parcels that had a change in their land use designation within the last two years, parcels owned by a builder or developer, and parcels with new construction permit issued within the last two years.
When examined holistically, these data points can pinpoint up-and-coming American boomtowns.
So, then which are the slowest-growing metros in the U.S.?
Figure 2 shows the bottom 20 Metros according to the same composite score as Figure 1, but unlike the fastest-growing metro areas in the U.S., the metros at the bottom of the list are all over the map. There are five MSAs each in the Midwest and California, and the Northeast is home to another 10.
The Los Angeles area (both Oxnard and Los Angeles proper), is easily growing at the slowest pace, according to the indicators measured. There are two reasons for this.
Why Los Angeles is the slowest-growing American metro?
- There is a very low number of properties with a change in land use designation, which is likely due to stringent local regulations.
- Los Angeles is contiguous with the Riverside MSA, which has a much higher composite score. The result is that the neighboring MSA absorbs a lot of the growth that is influencing the greater LA region.
To determine where development may arrive next, the five indicators can be separated by the stages of growth they capture.
Which indicators show that growth has recently occurred?
- New construction
- Recent build indicators
Which signals indicate that growth is imminent?
- Land use change
- Ownership by a builder or developer
- Recent new construction in the area
Following this logic, Figure 3 divides the composite score used in Figure 1 and 2 into two separate indicators: a recent growth indicator, which is the sum of the new construction and recent build shares in an MSA, and an imminent growth indicator that is the sum of the other indicators. Figure 3 plots these two variables against each other.
The figure shows a tight relationship (the correlation is 0.7) between recent growth and future growth.
Which U.S. cities are poised for growth?
Albuquerque, NM; Madison, WI; and Milwaukee, WI have all seen recent land use changes. While property developments have not yet followed, there are indications that development is on the horizon.
Looking at the top left of Figure 3 reveals other MSAs that may also be primed for growth.
Growth indicators are also highly correlated with population changes. Figure 4 compares the two statistics, and a tight connection is clear between increasing populations and the number of growth indicators; the correlation is 0.8. However, there are some outliers like Miami.
Miami has a relatively low score according to the growth indicators, but it has significant population growth. Therefore, Miami could be characterized as a city that is revitalizing rather than expanding. The fact that Miami is growing in this fashion is not particularly surprising. Since Miami was one of the most overbuilt areas of the country in the lead up to the financial crisis of the 2000s, it still has many vacant homes. As a result, there is less need to build for an increasing population than in other MSAs.
It is safe to say that the South is growing while other regions of the U.S. are either stagnant or shrinking. Growth indicators support this conclusion and further indicate which areas may be next to see a population boom.
An important caveat though is that these indicators only signal short-term growth, and a snapshot of the indicators will not necessarily predict longer term growth patterns. Instead, these growth indicators should be considered in conjunction with economic fundamentals to predict long term future growth and help design a plan for future development.


